Big Spending at PISD
Since the school district is considering next year’s budget and a possible
tax increase is on the table, it will be enlightening to launch a series of
articles analyzing PISD’s expenditures. The following table is a comparison of
the operating and instructional cost per pupil among large school districts with
more than 25,000 students. The data is taken from Snapshots which is an annual
report published by the Texas Education Agency (TEA). The expenditure
information are provided by each school district to the state agency which also
publishes the report on its internet website.
It has been alleged by our district that the published operating cost per
pupil of $6,198 for year 1998 is wrong since it included recapture (the amount
of money paid to the state under Robin Hood). According to TEA, Plano was one of
eight districts that made erroneous submission in 1997 and they contacted the
district to make the necessary correction. In the following year, PISD became
one of three districts which erred in their reporting of data in this category.
After persistent attempts to get the correct figure, PISD offered the figure of
$5,488 as the operating cost per pupil for 1998 and also informed me that the
figure for 1999 would also have the same error since the submission was already
made.
Based on this figure provided by PISD, out of 33 districts Plano has the
highest instructional cost and the second highest operating cost (only $14 per
pupil less than Brownsville and San Antonio). The average operating cost for
these 33 districts is $4,871 per pupil which is $617 per pupil less than Plano’s.
With 43,000 kids in our district, we are outspending the average by $617 x
43,000 = $26.5 M.
The average instructional cost for these districts is $2,858 per pupil which
is $512 per pupil less than Plano’s. We outspend the average by $512 x 43,000
= $22 M.
In anticipation of expected excuses, I have shaded those fast growth
districts which experienced more than 20% growth in the last five years. Fast
growth does not lead to higher cost per pupil. On the contrary, one would expect
some benefit from economies of scale. I applaud recent efforts by the board to
demand serious cost cutting from the administration.
Comparison of Large Districts
Ranked by Operating Cost per Pupil
|
No. |
District |
5 yr. % Growth |
Operating Cost per Pupil |
Instructional Cost per Pupil |
| |
Plano |
30.9 |
(erroneous) $6,198 |
$3,370 |
|
1 |
Brownsville |
3.5 |
$5,502 |
$3,244 |
|
2 |
San Antonio |
2.1 |
$5,502 |
$3,206 |
|
3 |
Plano |
30.9 |
(PISD’s figure) $5,488 |
$3,370 |
|
4 |
North East |
10.1 |
$5,295 |
$3,168 |
|
5 |
Houston |
6.6 |
$5,245 |
$3,005 |
|
6 |
Spring Branch |
12.7 |
$5,236 |
$3,023 |
|
7 |
Aldine |
13.8 |
$5,170 |
$3,062 |
|
8 |
Northside |
11.3 |
$5,133 |
$3,134 |
|
9 |
Richardson |
2.7 |
$5,127 |
$3,010 |
|
10 |
Dallas |
12.8 |
$5,079 |
$2,929 |
|
11 |
Killeen |
16.8 |
$5,024 |
$2,803 |
|
12 |
Conroe |
21.2 |
$4,979 |
$2,876 |
|
13 |
Fort Worth |
8.2 |
$4,947 |
$2,675 |
|
14 |
Klein |
10.5 |
$4,930 |
$2,950 |
|
15 |
Irving |
9.3 |
$4,881 |
$3,004 |
|
16 |
Ysleta |
- 3.4 |
$4,865 |
$2,869 |
|
17 |
Corpus Christi |
- 2.9 |
$4,821 |
$2,831 |
|
18 |
Lewisville |
41 |
$4,766 |
$2,930 |
|
19 |
Cypress-Fairbanks |
20 |
$4,757 |
$2,820 |
|
20 |
Austin |
9.7 |
$4,749 |
$2,761 |
|
21 |
El Paso |
- 0.5 |
$4,728 |
$2,678 |
|
22 |
Alief |
22.6 |
$4,726 |
$2,908 |
|
23 |
Lubbock |
- 2.5 |
$4,724 |
$2,642 |
|
24 |
Pasadena |
4.1 |
$4,698 |
$2,757 |
|
25 |
Round Rock |
24.7 |
$4,697 |
$2,880 |
|
26 |
Katy |
30.3 |
$4,652 |
$2,798 |
|
27 |
Fort Bend |
20.6 |
$4,623 |
$2,318 |
|
28 |
Ector County |
1.6 |
$4,585 |
$2,524 |
|
29 |
Amarillo |
2.5 |
$4,573 |
$2,810 |
|
30 |
Clear Creek |
19 |
$4,386 |
$2,687 |
|
31 |
Mesquite |
12.6 |
$4,357 |
$2,365 |
|
32 |
Arlington |
13.7 |
$4,317 |
$2,661 |
|
33 |
Garland |
15.3 |
$4,184 |
$2,626 |
|
Average Cost for 33 districts |
|
|
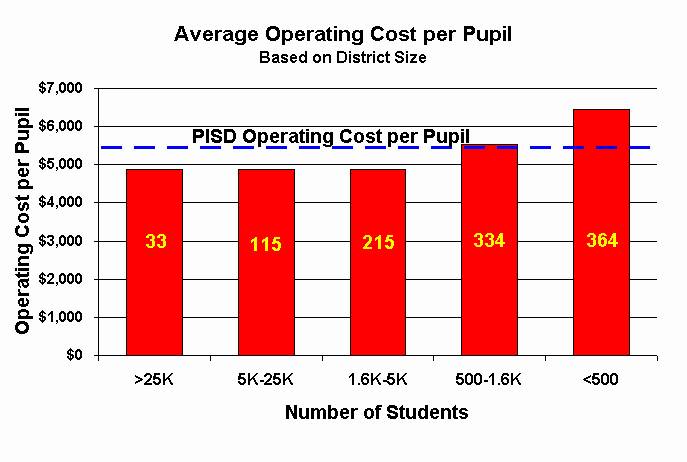
Spending like a small
district
Among the 33 districts with more than 25,000 students, Plano
has the second highest operating cost per pupil. Fast growth does
not necessarily explain this high cost for there are many
districts facing fast growth but have a far lower per capita cost
than PISD. The fact that we are a Robin Hood district also does
not explain the high cost for those property wealthy districts
with higher operating cost have significantly lower student
population. Our operating cost per pupil actually reflect the cost
of educating a student in a district size of between 500 and
1,600.
This is the second part of a study on PISD’s operating
expenditure. The number within each column shows the number of
districts within that size category. About two thirds of Texas
districts are very small districts.
PISD spends about $600 more per pupil than districts with more
than 1,600 students! With a student population of 43,000, the
total adds up to a sizable $25.8 million. We should spend less
time blaming Robin Hood and start looking for the real causes of
our woes.
Comparison with
Rich Districts
In the previous study, we have seen that PISD’s operating
cost per pupil is close to the average for a small Texas district
with between 500 and 1,600 students. For a district with close to
45,000 students, we do not seem to be reaping any benefits from
economies of scale.
It is true that many districts with the same or greater
property wealth as Plano shows a higher operating cost per
student. However, these districts have significantly smaller
student population. Plano still substantially outspends large
"Robin Hood" districts with more than 10,000 students,
e.g., Richardson, Carrollton-Farmers Branch, Coppell,
Grapevine-Colleyville and Brazosport. Ironically, many of these
districts achieve higher ratings from the Texas Education Agency.
To be put it bluntly, they are spending less but achieving more.
Lest it be said that we have a more challenging student
profile, I am furnishing this table to preemptively invalidate
that premise. The table identifies "Robin Hood"
districts with more than 5,000 students which have a higher rating
than Plano (either Exemplary or Recognized). Brazosport, with the
most challenging student profile, spends about $900 less per pupil
than Plano and is rated Exemplary. Incidentally, some of you may
notice that Plano has the smallest percentage of kids enrolled in
gifted and talented programs.
These six districts have an average operating cost of $5,218
which is $270 less than ours. One can only appreciate how
staggering this amount is after we multiply it by 43,000 students.
In effect, we outspent the average of these five property wealthy
districts by a grand total of about $12 million in 1998. How can
so much be spent on so many to accomplish so little?
The school board is considering raising taxes. No matter how we
look at the numbers, the problem does not seem to be lack of
funds. Growth in our tax base, recent relief from Robin Hood, and
the availability of more state aid should more than sufficiently
cover our growth needs. Further infusion of funds by increasing
taxes would only produce a grotesquely unflattering image of our
community at the state capitol where we constantly lobby for Robin
Hood relief.
Before we spend even more money, we should identify the causes
for our relatively poorer performance, particularly in the lower
grades. How our kids manage to turn in "sterling" SAT
performances in latter years is the subject of numerous
conjectures. Parents and the business community in Plano should
urge this district to re-assess their present spending priorities
before raising our already high tax rates.
Comparison of Big "Robin Hood"
Districts (>5,000 students)
with Better Rating than PISD
Ranked by operating cost per pupil from left to
right
Data from Snapshots ’98 published by the Texas
Education Agency
| |
Eanes |
Highland Park |
Plano |
Coppell |
Grapevine-Colleyville |
Brazosport |
|
Operating Cost per Pupil |
$5,717 |
$5,556 |
$5,488 |
$5,043 |
$4,929 |
$4,573 |
|
%age Growth 1993-1998 |
20.9 |
27.5 |
30.9 |
77.9 |
26.2 |
4.8 |
|
Student Population (1998) |
7,184 |
5,695 |
43,323 |
7,722 |
12,867 |
13,131 |
|
Academic Rating |
Exemplary |
Exemplary |
Academically Acceptable |
Exemplary |
Recognized |
Exemplary |
|
Student Profile (%) |
|
|
|
|
|
|
|
African-American |
1 |
0 |
6 |
3 |
2 |
9 |
|
Hispanic |
4 |
1 |
8 |
7 |
6 |
33 |
|
White |
90 |
97 |
76 |
79 |
89 |
57 |
|
Other |
5 |
2 |
11 |
11 |
3 |
2 |
|
Econ. Disadvantaged |
2.4 |
0 |
8.8 |
3.8 |
6.4 |
36.4 |
|
Special Education |
11 |
9 |
10 |
8 |
9 |
14 |
|
Bilingual/ESL |
1 |
0 |
5 |
3 |
1 |
7 |
|
Career/Technology |
5 |
2 |
16 |
11 |
16 |
24 |
|
Gifted/Talented |
11 |
12 |
7 |
14 |
24 |
10 |
|
Overspending Analysis |
by writer |
|
|
|
|
|
|
Diff. from Ave. Cost ($5,218) |
$499 |
$338 |
$270 |
($175) |
($289) |
($645) |
|
Diff. x Student Population |
$3.6M |
$1.9M |
$11.7M |
($1.4M) |
($3.7M) |
($8.5M) |
Proportional
Expenditure Comparison
ranked by operating cost per
pupil from left to right
based on 1998 data
| |
Eanes |
Highland Park |
Plano |
Spring Branch |
Richardson |
Coppell |
Grapevine-Colleyville |
Katy |
Brazosport |
Clear Creek |
|
Operating Cost per Pupil |
$5,717 |
$5,556 |
$5,488 |
$5,236 |
$5,127 |
$5,043 |
$4,929 |
$4,652 |
$4,573 |
$4,386 |
|
Revenue per Pupil |
$7,031 |
$5,910 |
$6,884 |
$5,843 |
$11,198 |
$6,049 |
$5,750 |
$5,553 |
$5,498 |
$5,215 |
|
Recapture |
$10.5 M |
$30 M |
$30 M |
0 |
$10 M |
$4 M |
$10 M |
$137K |
0 |
0 |
|
Recapture per pupil |
$1,461 |
$5,268 |
$692 |
0 |
$293 |
$518 |
$777 |
$5 |
0 |
0 |
|
%age Growth 1993-1998 |
20.9 |
27.5 |
30.9 |
12.7 |
2.7 |
77.9 |
26.2 |
30.3 |
4.8 |
19.0 |
|
Student Population |
7,184 |
5,695 |
43,323 |
30,880 |
34,106 |
7,722 |
12,867 |
28,230 |
13,131 |
28,200 |
|
Academic Rating |
Exemplary |
Exemplary |
Acceptable |
Acceptable |
Acceptable |
Exemplary |
Recognized |
Recognized |
Exemplary |
Recognized |
|
Expenditure by Proportion (%) |
|
|
|
|
|
|
|
|
|
|
|
Payroll Costs |
66.1 |
77.8 |
67.3 |
76.2 |
73.8 |
68.9 |
71.0 |
72.4 |
70.9 |
73.6 |
|
Prof. & Contracted Services |
7.0 |
7.8 |
9.2 |
6.4 |
9.8 |
8.4 |
8.0 |
4.9 |
6.5 |
7.4 |
|
Supplies & Materials |
5.7 |
3.5 |
6.3 |
5.5 |
4.3 |
5.9 |
5.3 |
4.8 |
6.7 |
4.5 |
|
Other Operating Costs |
1.4 |
1.2 |
1.6 |
1.3 |
0.8 |
1.8 |
1.8 |
1.1 |
1.6 |
1.2 |
|
Debt Service |
19.1 |
9.0 |
12.6 |
8.8 |
10.2 |
9.7 |
13.7 |
14.3 |
6.1 |
12.2 |
|
Capital Outlay |
0.7 |
0.6 |
3.1 |
1.8 |
1.1 |
5.4 |
0.2 |
2.4 |
8.2 |
1.1 |
|
Staff |
|
|
|
|
|
|
|
|
|
|
|
Total Staff FTE |
905 |
642 |
4,679 |
4,021 |
3,941 |
881 |
1,532 |
3,144 |
1,507 |
3,030 |
|
Total Teachers FTE |
524 |
418 |
2,818 |
2,018 |
2,200 |
509 |
854 |
1,719 |
767 |
1,676 |
|
Avg Central Admin Salary |
80,624 |
115,661 |
78,765 |
82,080 |
62,494 |
65,333 |
69,277 |
77,941 |
78,122 |
63,934 |
|
Avg Campus Admin Salary |
60,306 |
76,066 |
63,853 |
58,418 |
56,459 |
52,739 |
53,144 |
56,037 |
56,088 |
53,783 |
|
Avg Profess, Sup. Staff Salary |
41,084 |
46,138 |
43,710 |
42,073 |
42,099 |
38,756 |
40,414 |
43,905 |
39,474 |
40,136 |
|
Avg Teacher Salary |
35,889 |
36,990 |
36,540 |
36,020 |
35,351 |
33,134 |
33,519 |
35,488 |
36,173 |
33,940 |
|
No. of Students per Staff |
7.9 |
8.9 |
9.3 |
7.7 |
8.7 |
8.8 |
8.4 |
9.0 |
8.7 |
9.3 |
|
No. of Students per Teacher |
13.7 |
13.6 |
15.4 |
15.3 |
15.5 |
15.2 |
15.1 |
16.4 |
17.1 |
16.8 |
|
Student Profile |
|
|
|
|
|
|
|
|
|
|
|
African-American |
1 |
0 |
6 |
6 |
20 |
3 |
2 |
5 |
9 |
7 |
|
Hispanic |
4 |
1 |
8 |
46 |
15 |
7 |
6 |
13 |
33 |
11 |
|
White |
90 |
97 |
76 |
40 |
55 |
79 |
89 |
78 |
57 |
74 |
|
Other |
5 |
2 |
11 |
8 |
9 |
11 |
3 |
4 |
2 |
9 |
|
Econ. Disadvantaged |
2.4 |
0 |
8.8 |
49.8 |
29.8 |
3.8 |
6.4 |
10.8 |
36.4 |
10.8 |
|
Special Education |
11 |
9 |
10 |
11 |
11 |
8 |
9 |
9 |
14 |
8 |
|
Bilingual/ESL |
1 |
0 |
5 |
29 |
13 |
3 |
1 |
5 |
7 |
4 |
|
Career/Technology |
5 |
2 |
16 |
13 |
17 |
11 |
16 |
13 |
24 |
11 |
|
Gifted/Talented |
11 |
12 |
7 |
5 |
5 |
14 |
24 |
7 |
10 |
8 |
|
College Admission Tests |
Class of |
1997 |
|
|
|
|
|
|
|
|
|
Percent Tested * |
91.3 |
107.7* |
83.1 |
72.4 |
88.9 |
93.7 |
84.9 |
82.2 |
70.6 |
81.7 |
|
Percent At/Above Criterion |
63.3 |
64.7 |
52.7 |
48.1 |
46.0 |
46.4 |
41.3 |
42.1 |
37.9 |
44.2 |
|
SAT I: Mean Total Score |
1,145 |
1,153 |
1,113 |
1,091 |
1,072 |
1,084 |
1,068 |
1,065 |
1,047 |
1,080 |
|
ACT: Mean Composite Score |
24.2 |
23.9 |
23.5 |
22.3 |
22.5 |
22.4 |
22.3 |
22.3 |
21.7 |
21.4 |
|
Other analysis by writer |
|
|
|
|
|
|
|
|
|
|
|
% tops in elem. Reading |
66.7 |
50 |
44.4 |
58.3 |
40.5 |
71.4 |
54.5 |
40.5 |
72.7 |
56.3 |
|
% tops in elem. Math |
16.7 |
50 |
11.1 |
33.3 |
29.7 |
71.4 |
0 |
25 |
63.6 |
27.8 |
|
% tops in elem. reading & math |
16.7 |
50 |
7.4 |
29.2 |
27 |
42.9 |
0 |
25 |
81.8 |
27.8 |
|
Diff. from Avg. Cost ($5,071) |
$646 |
$485 |
$417 |
$165 |
$56 |
($28) |
($142) |
($419) |
($498) |
($685) |
|
Diff. x Student Population |
$4.6 M |
$2.8 M |
$18.1 M |
$5.1 M |
$1.9 M |
($0.2 M) |
($1.8 M) |
($11.8 M) |
($6.5 M) |
($19.3 M) |
Cost Analysis
3rd highest operating cost per pupil
2nd lowest percentage for payroll but second highest
for professional & contracted services as Supplies &
Materials.
3rd in Debt Service and Capital Outlay.
Salary Comparison
4th in average central admin. salary
2nd in average campus admin. salary
3rd in average professional support staff salary
4th in average central admin. salary
2nd in average teacher salary
College Results
5th lowest percentage taking SAT
3rd highest at or above criterion
3rd highest SAT mean total score
2nd highest ACT mean composite score
Elementary Proficiency
3rd lowest in reading
2nd lowest in math
2nd lowest in both reading and math
|
|